In my last post I mentioned that the rendering performance of Cantabile’s new UI engine (GuiKit) wasn’t as good on OS X as it was on Windows.
In reality, the more I looked into it the more apparent it became that it was actually quite terrible. For the last two weeks I’ve set everything else aside (except support emails) to try and get it sorted.
The Baseline
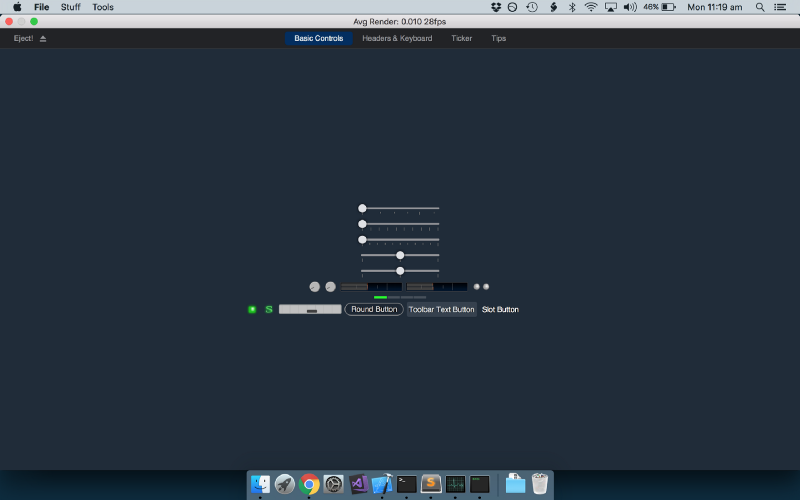
When performance tuning it’s always a good idea to have a baseline to compare changes to. For these tests I’ve been using the “Basic Controls” page of the GuiKit test harness:

I chose this screen because it represents what Cantabile is typically doing when used during live performance — not so much scrolling or resizing, but lots of small frequently updating widgets — especially the level meters and the MIDI activity indicators. I also chose to run it at full screen — again reflecting how Cantabile is typically used (and because I know this dramatically affects rendering times).
Before starting on this optimization work, here’s how CPU load compared on each platform:
- Windows: 0%
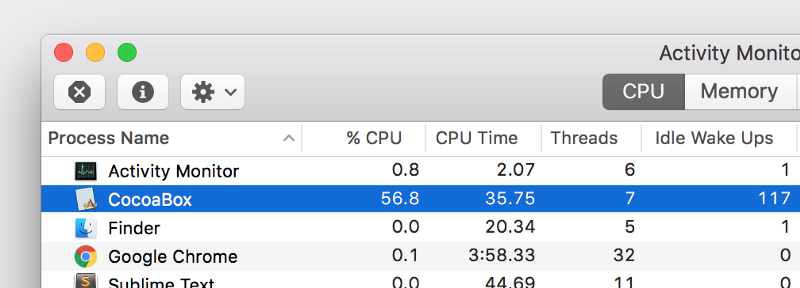
- OS X: 90%
Yes, a drastic difference.
All these tests were run on the same MacBook Pro Retina with macOS Sierra and Windows 10 (via BootCamp).
Cocoa Drawing is Slow
On seeing these numbers my first concern was that perhaps .NET Core 2 on OS X was slow — it is still in preview after all. The first test was to get a baseline on Cocoa’s re-draw speed by eliminating .NET from the equation.
(Cocoa is the programming interface to OS X’s windowing system)
I knocked together an empty Cocoa app in Objective-C that simply requested the main window be redrawn at 60 frames per second (fps). Even without actually drawing anything CPU load easily hit 20%, 30%, even 60% depending on the size of the Window.

Obviously .NET Core wasn’t the problem here but it also became apparent that I was going to have to re-think how GuiKit’s rendering works.
Considering OpenGL
After trying everything I could think of to get Cocoa drawing quickly I finally gave up and decided the only workable solution would be to switch to OpenGL.
(OpenGL is a way to talk more directly to the graphics card and typically used for fast 3D rendering ie: games)
The first step was to add some basic OpenGL support to GuiKit starting with a simple hard-coded spinning logo. At this stage GuiKit’s composited view engine wasn’t using it but it proved that it’s possible to do full screen updates at 60 fps on OS X at about 5% CPU load.
GuiKit’s rendering works in two phases — composition and presentation:
- Composition is the process of assembling all the UI pieces into a single image.
- Presentation is the process of moving that composed image to the screen so it’s visible.
One thing I knew by this point was that the composition phase was running quite well. It was the presentation stage that was slow under OS X so rather than moving all the rendering to OpenGL I thought I’d try using it just for presentation.
The result: my baseline test went from 90% to just under 60%. I was hoping for more, but it was a start…
Check the Frame Rate
The baseline test for this has a screen update rate of 60 fps. At some point during this process it occurred to me that I hadn’t actually verified this.
Adding some code to calculate and display the actual frame rate revealed:
- Windows: 38 fps
- OS X: 60 fps
Although I was asking for a 60 fps timer on both platforms, Windows was actually redrawing at a slower rate meaning OS X was doing about 50% more work than the Windows version.
I decided to level the playing field by adjusting the frame rate to 30fps on both platforms bringing the load on OS X to about 40% CPU.
Comparing Apples to Oranges
Up until this point I had assumed that Windows Task Manager and OS X’s Activity monitor were displaying roughly equivalent numbers for CPU load.
Then something occurred to me: all this UI code is single threaded yet the machine I’m using for testing is a dual-core hyper-threaded machine (4 virtual cores) so CPU load should never go above 25%, yet I was seeing 90% in some of those early tests.
I should have realized this sooner: Windows displays the CPU load as a percentage of all CPU cores whereas OS X displays it as a percentage of one core.
I couldn’t find anything online to verify whether OS X displays it as a percentage of physical or virtual (hyper-threaded) cores so I ran a quick test with multiple instances of a program spinning in a tight infinite loop. On my test machine the total available CPU load is 400% meaning it’s a percentage of virtual cores.

Oops! All those numbers I quoted for OS X above need to be divided by 4 before comparing them to Windows.
Doing a fair comparison: Windows 0%, OS X 10%. Getting closer…
Profiling without a Profiler
Early on in this process I’d done some basic profiling of GuiKit using Visual Studio’s profiling tools just to make sure there were no obvious bottlenecks.
One of the problems with using bleeding edge technology like .NET Core 2 (which is still in preview) is that the tools are somewhat lacking — as in there’s no simple way to profile .NET code on OS X.
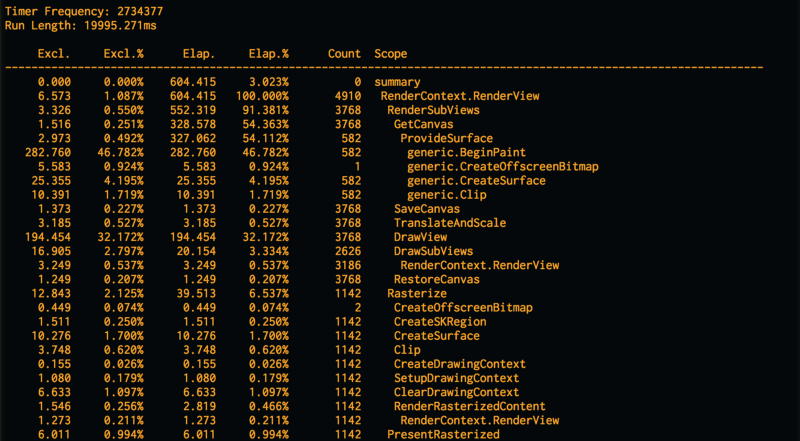
Convinced that there was still something fundamentally wrong when running on OS X I decided the only way to get some insight was to write my own profiling code.
Here’s what it showed for Windows:

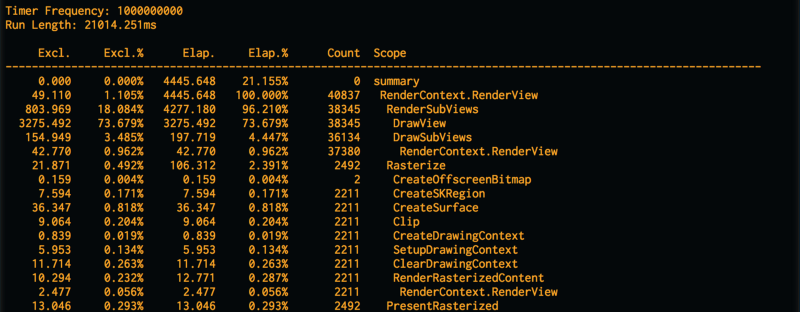
Here’s an a similar run on OS X:

Take a look at the Count column — that’s how many times each part of the rendering engine was called and it shows OS X doing about 10x more work than Windows.
Ugh… while making the changes to support OpenGL I’d accidentally broken the code that culled regions of the screen that didn’t need to be updated. Annoyingly I’d managed to break only the OS X version and not the Windows version — again skewing all the results.
After a trivial fix, performance was starting to look reasonable at a about 6% (24% as displayed in Activity Monitor).
GPU Based Composition
Back when I first starting thinking about the design of GuiKit2 I spent a couple of weeks experimenting with OpenGL and how it could be used to make Cantabile’s screen updates faster. I wrote a fairly comprehensive library for drawing UI elements but in the end set it aside.
One thing that did come out of those experiments though was a good understanding of how to move composition to the graphics card — aka the “GPU”.
The idea behind this is instead of composing one big image and sending it to the graphics card for every update, all the “bits and pieces” of the screen are kept in the GPU’s on-board memory and the final image is composed by sending instructions for how to put them all together to form the final image.
This improves performance in a few ways:
- Only newly visible or changed elements need to be sent to the GPU (instead of the whole screen).
- Graphics cards are purpose built for pushing around large numbers of pixels — especially when those pixels are already in GPU memory.
- The presentation phase essentially goes away — the GPU does that implicitly.
- It frees up the CPU to other things (like running your audio plugins).
Looking at the updated profiling results it became apparent that much of the work was now in the composition phase so I dug out that old OpenGL code and lifted a few key pieces.
It took a couple of days, but in the end it fitted in quite nicely and the results were great: GPU based composition got the CPU load down to less than 1% (reported as about 4% by OS X).
Here’s a little video showing the difference, starting in software only mode, then switching to GPU for presentation and then finally using the GPU for composition and presentation.
Some notes: 1) the CPU loads are higher than normal due to the screen recorder 2) it takes a few seconds for Activity Monitor to update the displayed load 3) you might need to switch the video to high-def mode to be able to read the numbers.
Finally I felt like the rendering performance on OS X was acceptable.
Conclusion
All this performance tuning has taken about 2 weeks of long days and nights that I wasn’t originally planning. Cantabile’s performance is something I take very seriously though and I think the results speak for themselves.
At this stage I’m not quite 100% committed to the OpenGL approach:
- It’s a more complex setup, meaning more possible failure points.
- I’m not sure about compatibility with different graphics cards yet.
- There’s the possibility for conflicts with plugins that also use OpenGL (it should work, but bugs in GuiKit and/or a plugin open the possibility for issues).
- The machine seems to run slightly warmer so there might be an impact on battery life (but you shouldn’t be using Cantabile on battery power anyway).
I’ll certainly be providing an option to enable/disable it until it’s proven.
All that said, I’m now at the point where I feel comfortable that GuiKit is viable on OS X (which I wasn’t at all confident about when I first looked at those performance numbers).
I’ve now been working on the OS X port for about 6 hectic weeks straight. This feels like a good place have a break so I’m going to set it aside for a couple of weeks while I do some work on the current Windows version. New builds coming soon.
