For any software used in live performance, rock solid stability is the number one priority. This has always been, and always will be the primary goal of Cantabile.
The most important tool in diagnosing stability problems is the Crash Dump.
A crash dump contains a snapshot of the program at the time at which an exception occurred and when combined with properly archived debug files from when the software was built it can often point directly to the line of code where things went awry.
Unfortunately, not all plugin developers create and keep the required debug files to get the most value from these crash dumps.
This post is intended for plugin developers and explains a few simple steps that can be easily integrated into your build procedure to ensure you have everything you need to work with a crash dump.
What You’ll Need To Keep
To make the most of a crash dump there are two things you’ll need:
- Source Code — the code for your plugin at the time it was built
- PDB Files — from the release mode build of your plugin
It’s important that these files match the version of the plugin that caused crash otherwise the debugging session won’t make sense.
Source Code
I’m not going to dive too deeply into this area because you should already be using a version control system for your software (and if you’re not, you’re doing yourself a disservice). Personally, I use Git but there are others. Find one you like and use it.
Also, make sure your build procedure checks that everything is committed and appropriately tagged with a version/build number so that you can get back to the correct source code for any publicly released build.
PDB Files
Program Database files (aka PDB files) store the debug information about your plugin — most importantly how the addresses of machine instructions map to your source code.
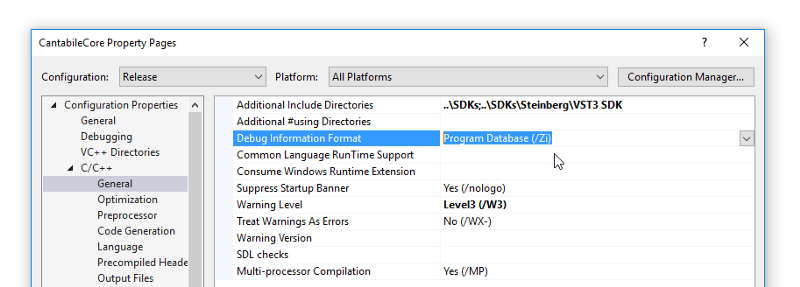
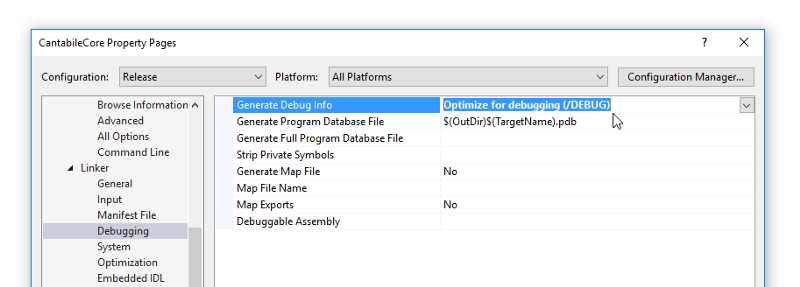
To check that you’re generating these files open the project in Visual Studio, go to Project Properties, make sure you’ve selected the “Release” configuration and then check the following settings:
- In C/C++ → General settings set Debug Information Format to “Program Database (/Zi)”
- In Linker → Debugging set Generate Debug Info to “Optimize for debugging (/DEBUG)”
- On the same page take note of the Generate Program Database File setting — this is the PDB file that you need to archive.
Here’s the settings for Cantabile’s core audio engine module:
Archiving PDB Files
Since you’ll need the correct PDB files to debug a crash dump your first thought might be to simply zip up these files and tag them with the version/build number.
I used to think that too but… there’s a much easier way.
The problem with just zipping them up is that every time you need to look at a crash dump you need to figure out which version it was and setup Visual Studio to be able to find it. It gets very tedious, very quickly.
The easier solution is to create a Symbol Store. A symbol store is simply a directory with .dll and .pdb files organized in a such a way that Visual Studio can automatically find the correct files for whatever you’re debugging.
To manage a symbol store Microsoft supplies a command line tool called symstore.exe which is included in the Debugging Tools For Windows.
Put it somewhere on your path and then update your build procedure to call it. Here’s how Cantabile’s build procedure stores symbols:
symstore add /r /f .\build\x64\*.* /s \\cool\public\ToptenSymbols
             /t “Cantabile 3.0” /v “Build %BUILD_NUMBER%”
symstore add /r /f .\build\Win32\*.* /s \\cool\public\ToptenSymbols
             /t “Cantabile 3.0” /v “Build %BUILD_NUMBER%”
To explain:
- /r — search the specified directories recursively for .pdb and .dll files
- /f \build\x64 (and \build\Win32) — the output folders of the build
- /s \\cool\public\ToptenSoftware — my symbol store folder
- The other parameters are optional and simply tag the build with version and build number
In other words, after the project has been built SymStore goes through the output folders locating all .dll and .pdb files and copies them to \\cool\public\ToptenSoftware using a folder hierarchy suitable for Visual Studio’s debugger to find them.
In my case \\cool is a simple NAS server on my network — you could just as easily dump them in Dropbox or anywhere else convenient. Putting them somewhere shared means you can debug using any machine on your network.
Debugging without Symbols
Let’s say you’ve just received a crash dump (a .mdmp file). For demonstration purposes let’s first have a look at what happens without symbols…
Double clicking the .mdmp file will open it in Visual Studio and you’ll get a screen like this:
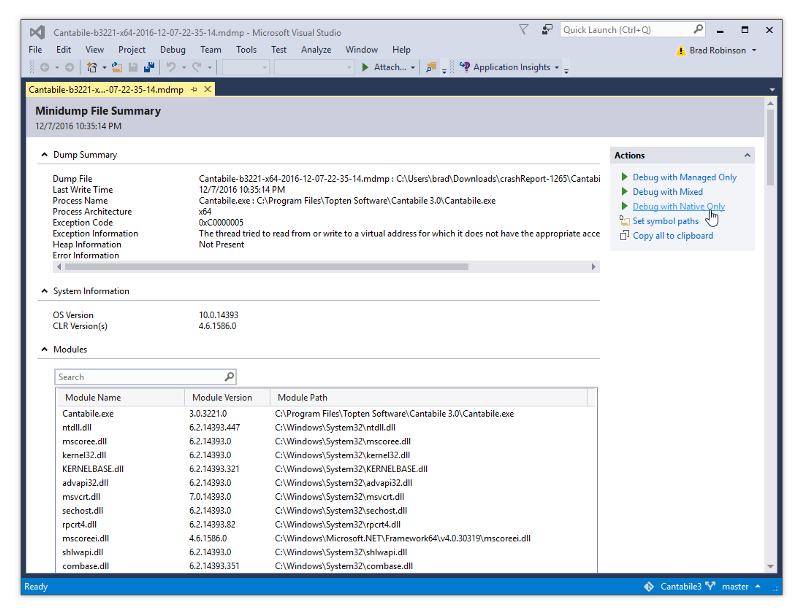
Click the “Debug with Native Only” link and you’ll get a second screen like this:
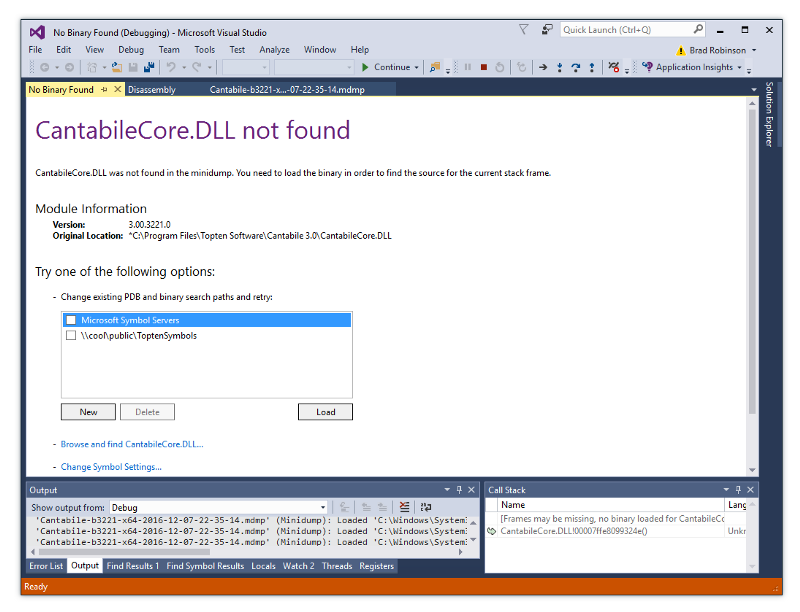
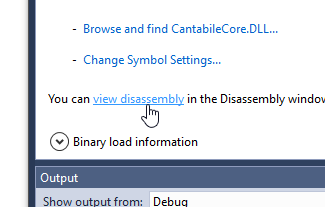
Hrm… not very useful, but if you scroll down a little you’ll see a link to “View Disassembly”.
Which gives this almost as useless listing:
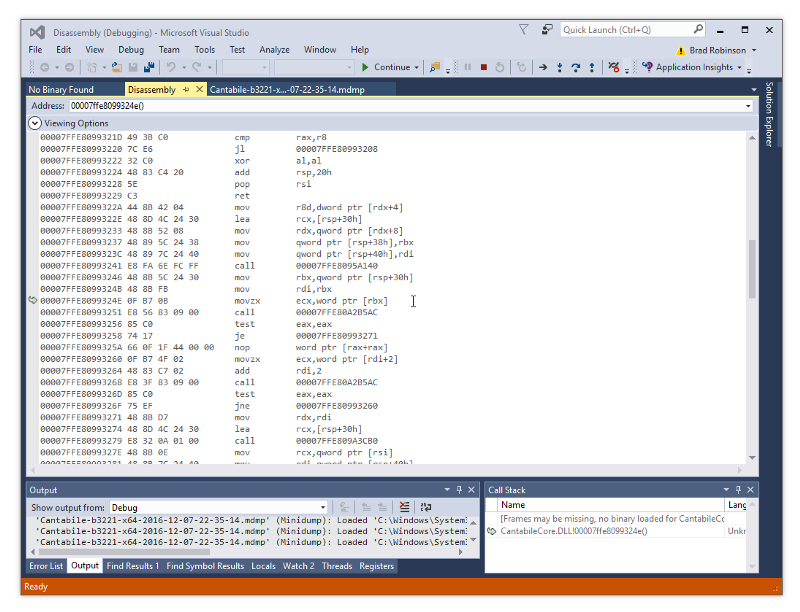
(Actually if you know what you’re doing and you’re very keen you can figure out what went from this but it’s hard work!)
Debugging with Symbols
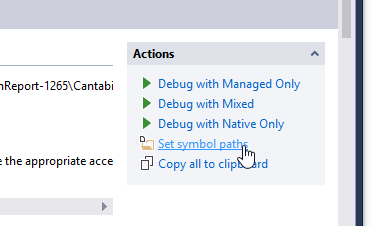
OK, let’s try all this again using our symbol server. Close Visual Studio and double click the crash dump to start again. This time click the “Set symbol paths” link:
Click the “New Folder” button and type the location of your symbol server:
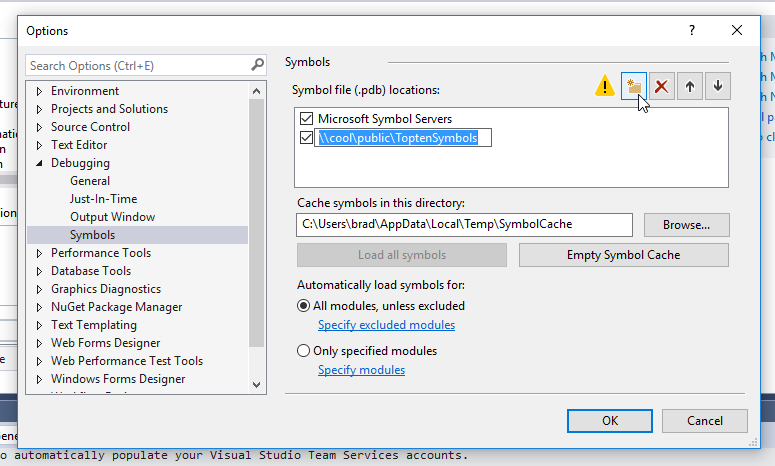
You’ll notice another entry “Microsoft Symbol Servers”. Selecting this option will slow things down but you’ll often get a more accurate call stack (which can make all the difference in figuring out what happened). I always turn this on.
Finally, click the “Debug with Native” link again and Visual Studio will start looking for symbol files for all the referenced modules:
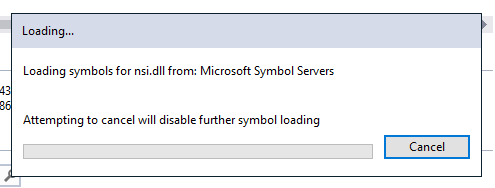
Go grab a coffee because this will take a while (especially if this is the first time you’ve run with the Microsoft Symbol Store) but eventually it’ll break at the location where the error happened:
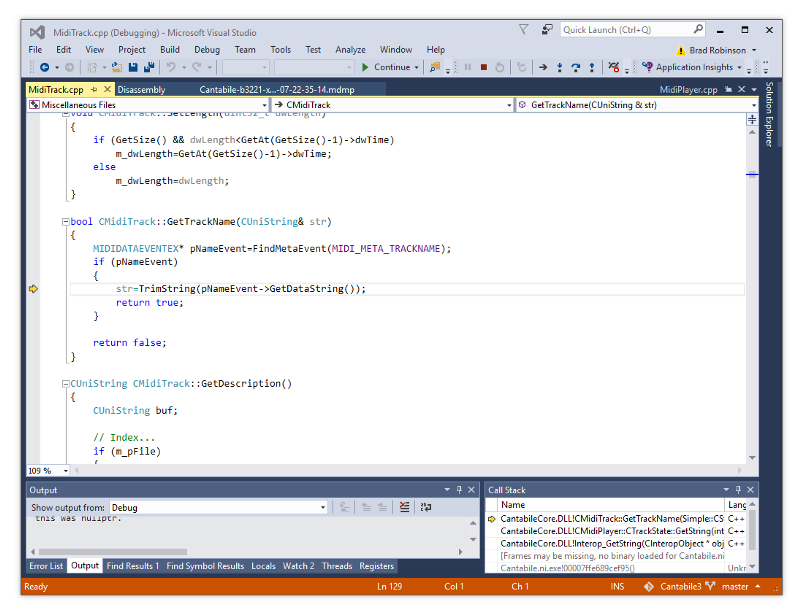
From here, it’s up to you to figure out what happened but I’m sure you’ll agree this is a much friendly place to be. There’s even a decent call stack.
How to Acquire a Crash Dump
So, where do these crash dumps come from?
Cantabile automatically captures a crash dump whenever it (or a loaded plugin) crashes. Not only that, but it also captures various log and setting files, zips them all up and they land in my inbox for me to review.
Most crash reports I receive are crashes in plugins. In these cases I’ll get in touch with the plugin’s developer and offer a copy of the crash dump and hopefully they’ll have archived everything they need to review it.
(Unfortunately, too often plugin developers aren’t prepared for this and come back asking for steps to reproduce the problem — which for some classes of bug is simply unreasonable)
For other hosts, acquiring a crash dump might be more involved. Here’s a Microsoft blog post explaining the options.
Identifying Plugin Versions
Often when reviewing a crash dump you’ll want to know which version of the plugin was running and/or possibly the host or other modules.
You can find this information in Visual Studio’s Modules window (accessible via Debug →Windows → Modules):

Even if you don’t version stamp your modules you can get a pretty good idea of which version from the timestamp column.
Mini Dumps vs Full Crash Dumps
When Windows captures a crash dump it can capture either a mini or full crash dump.
- Mini dumps include just the essentials — registers, stack segment and stack trace.
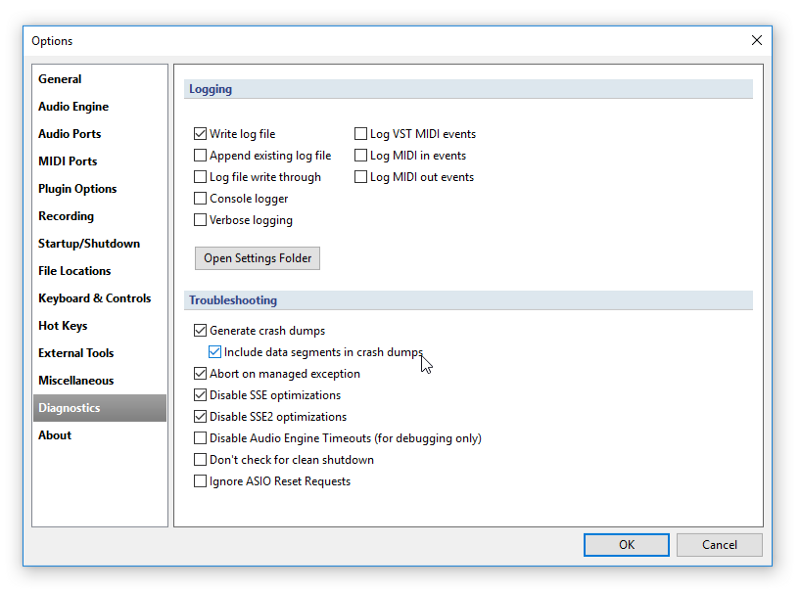
- Full crash dumps also include the data segments and can be enormous (as in multiple gigabyte enormous) but are handy if you need to know what was in memory when the crash happened.
Normally Cantabile only captures a mini dump but there’s an option to turn on full dump in Options → Diagnostics → Include Data Segments in Crash Dumps:
Understanding Cantabile’s Log File
A crash dump is all well and good but sometimes it’s useful to know what happened immediately before the crash occurred. Cantabile’s crash reports also include a copy of the log file.

The log file is a mostly self explanatory, but here’s a couple of tips:
- The first column is a time-stamp — the number of milliseconds since Cantabile was started.
- The second column is a time-stamp delta — the elapsed time since the previous line.
- The third square bracketed column is a thread id and log severity — the severity is 0 = critical, 1=warning, 2 and higher = informational. Thread Ids will match those shown in Visual Studio’s thread window when inspecting the crash report.
- Warning and error lines include an exclamation point !symbol to make them easy to search for
- The log messages themselves are often indented to highlight the grouping of an operation.
Plugin Processing Exceptions
The most common issue I see with plugins are “processing errors” — that is, an exception while calling the plugin’s process() or processReplacing() method.
Since I see these regularly, Cantabile logs some additional information:

Note the lines starting with ##. These are the parameters passed to the plugin and the terms “valid” indicate that the memory referenced by those pointers is valid according to the Win32 API function IsBadWritePtr.
In other words, on detecting a processing exception Cantabile does it’s best to validate that everything it passed to the plugin was valid.
Some Tips
A couple of other tips:
- Since the PDB files store the full path of the source code you can simplify your life by making sure you work on your projects in the same location on all machines. eg: I always put Cantabile’s source code in the folder C:\Users\Brad\Projects\Cantabile3 . No matter which machine I’m working on, the crash dumps always match the source code folder and I don’t need to browse to locate the files.
- Debugging release mode code can be tricky. Don’t trust everything you see in the debugger. eg: inspecting the this pointer, any local variables and parameters in the watch window will often display incorrect values (especially if you’ve moved up the call stack). Just be mindful that not everything is necessarily as the debugger reports it.
- During development, you don’t need to have the symbol settings enabled. Go to Options → Debugger → Symbols and clear the check marks next to any symbol stores.
Conclusion
Crash dumps are an essential tool in figuring out what caused a crash but they’re almost useless without the corresponding debug files. These debug files are easy to generate but painful to archive and locate when needed.
Setting up a symbol store solves this problem and is almost trivial to integrate into your build procedure
What is Cantabile anyway? See here.
Also, check out “Glitch Free” my free e-book on performance tuning Windows for reliable real-time audio.
